


Quick Links
People retain 65% of the information they see, but only remember 10% of the information they hear.
That’s the main reason why it’s so important to display information in a combination of visuals and words in an easy-to-read, consumable way.
With that said, let’s explore infographics for SEO and everything you need to know about them.
Ready to create a successful infographic?
What are Infographics?
An infographic is an example of a visual representation of information. Infographics are used as a powerful tool to help an audience understand information through the use of visual data, charts, and statistics.
Infographics help convey information at first glance, examples include a variety of elements, such as:
- Images
- Icons
- Text
- Charts
- Graphs,
- Diagrams
Although visual content can be valuable, you first need to have your audience’s attention span in mind.
Studies have shown an 82% increase in readers’ attention spans and recall through the use of colors in visuals.
Infographics, when used correctly can offer higher rankings in search engines, a boost in brand awareness, and an increase in backlinks.
They also make complex topics easier to understand and more enjoyable to look at.
Importance of Infographics in search engine optimization
With the proper use of color, negative space, and other elements, information can be memorable, attention-grabbing, and even persuasive.
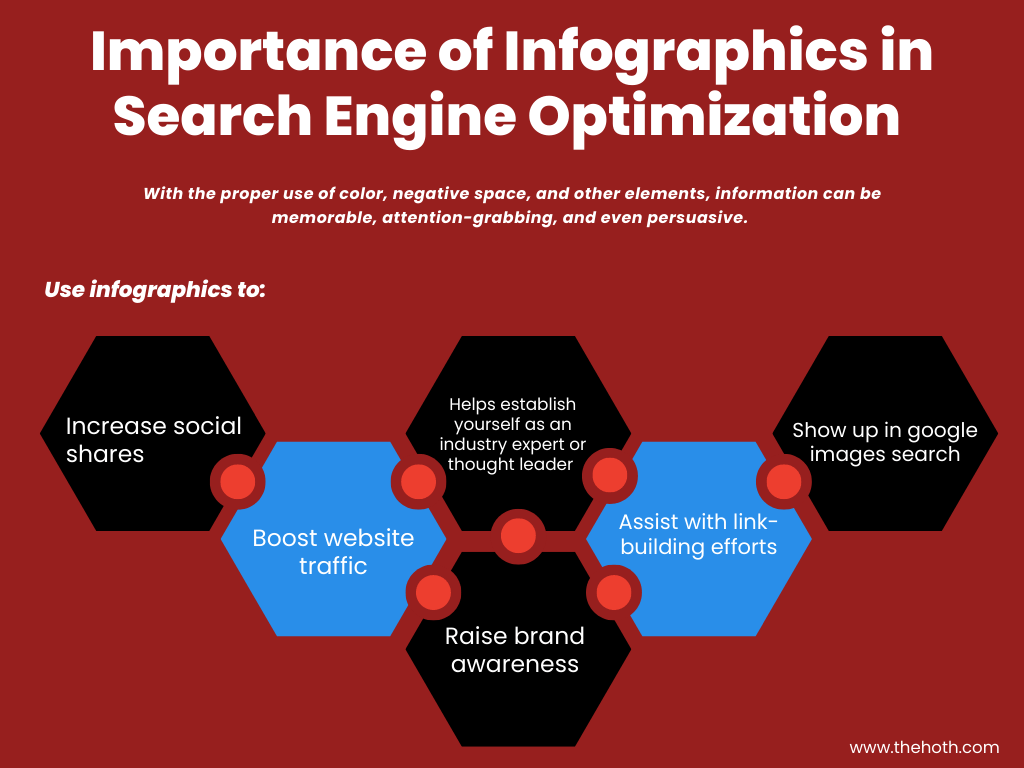
Use infographics to:
- Increase social shares
- Boost website traffic
- Raise brand awareness
- Assist with link-building efforts
- Show up in google images search
- Help you establish yourself as an industry expert or thought leader
In fact, infographics are the most effective strategy in digital marketing to present data or information in graphic visual form.
Let’s use David McCandless as an example here. He is the author and creator of Information is Beautiful and has done a good job in using a visual to explain what an effective infographic or data visualization looks like.
With that said, he incorporated four elements into his project.
Here are the four best practices for infographic and data visualization:
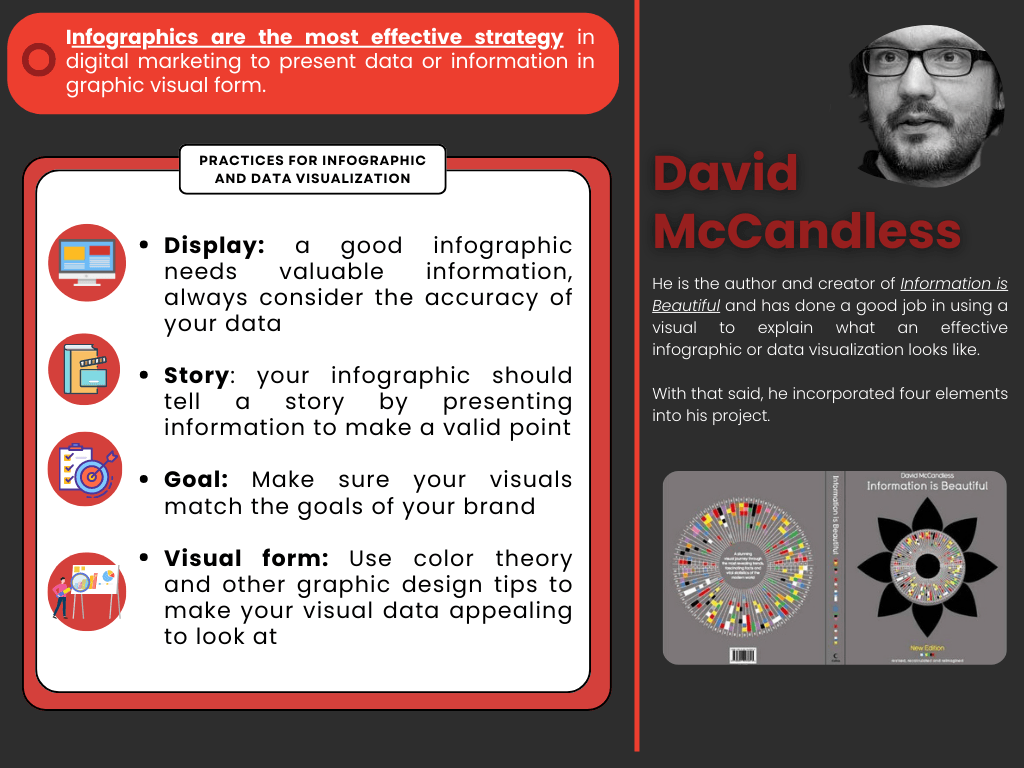
- Display: a good infographic needs valuable information, always consider the accuracy of your data
- Story: your infographic should tell a story by presenting information in order to make a valid point
- Goal: besides the presentation of information, what is the reason you want to create an infographic? Make sure your visuals match the goals of your brand
- Visual form: is your infographic easy on the eyes? Use color theory and other graphic design tips to make your visual data appealing to look at
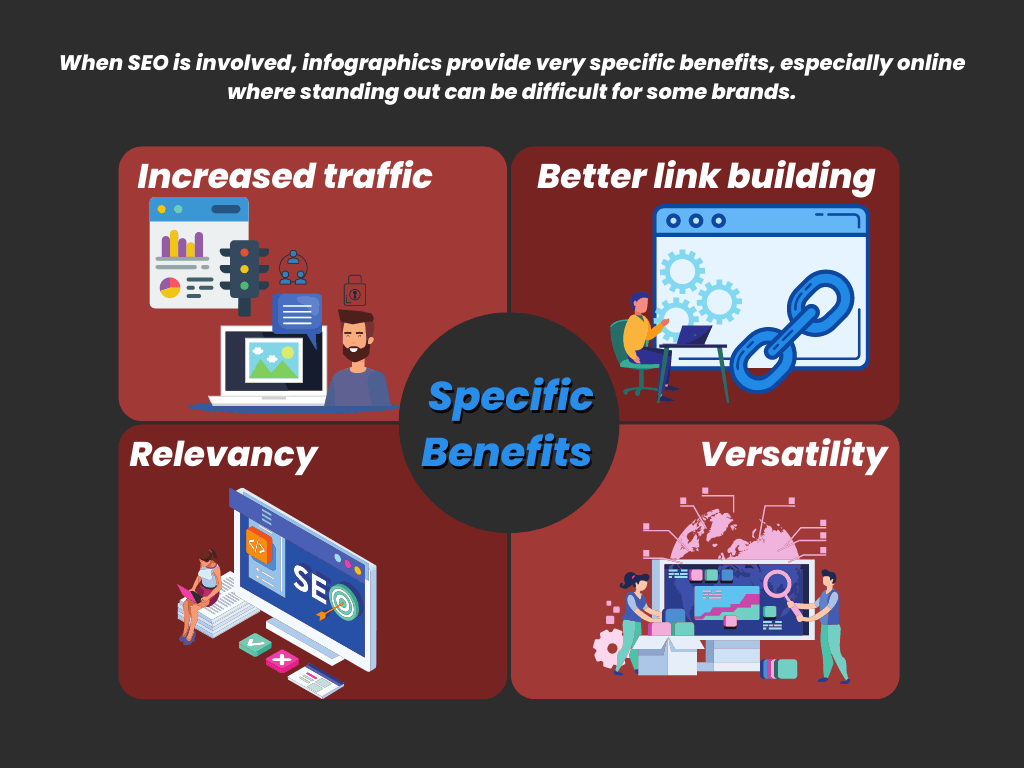
When SEO is involved, infographics provide very specific benefits, especially online where standing out can be difficult for some brands.
These specific benefits are:
- Increased traffic
- Better link building
- Relevancy
- Versatility
An infographic made for a specific group of people is a great way to increase your organic traffic. If it’s interesting and relevant, it has the ability to be more valuable.
According to Search Engine Journal, content and link building are two of the most important ranking factors.
Link building can be one of the most challenging aspects that infographics can help solve.
People are always looking for content to share or retweet, so when you create a solid infographic, it can pique the interest of a specific group of people.
They may want to share the information you’ve provided and link back to you.
An interesting infographic can circulate on the internet for years.
Depending on your thought-leadership status, you can approach different topics from unique angles. In doing so, you gain the chance of popularity years after a post has been published.
User experience and the visual nature of infographics make them more useful and helpful to your target audience.
With a divisible content marketing strategy, you can flip one infographic into many different pieces of content.
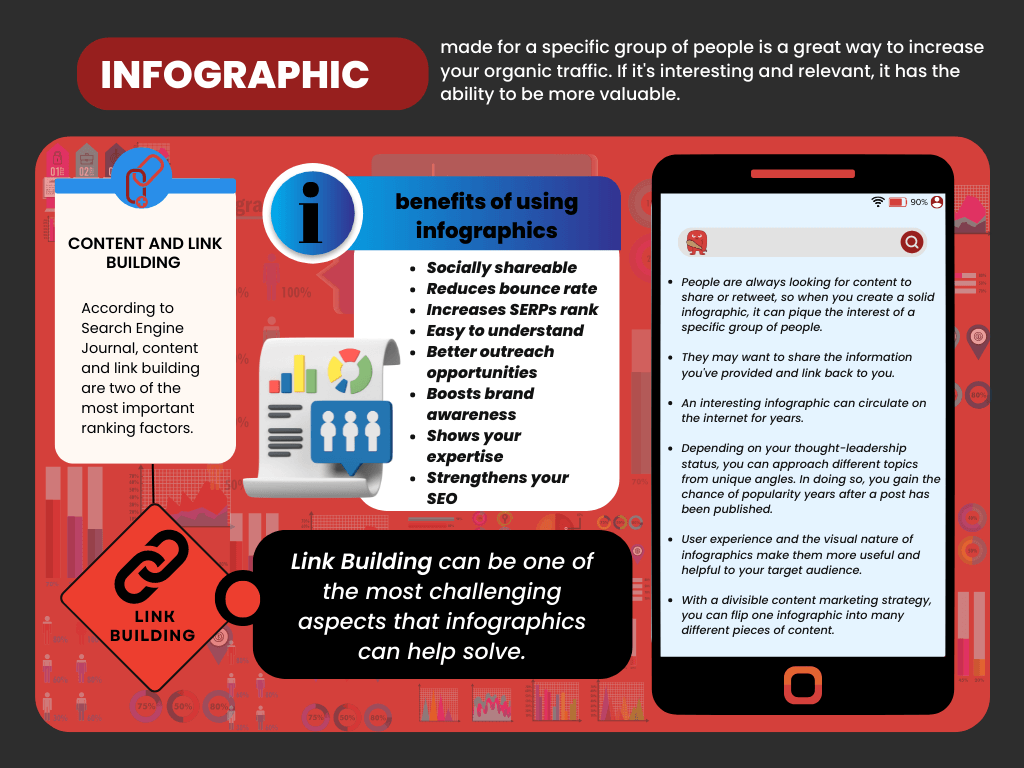
Here are some other benefits of using infographics in your content:
- Socially shareable
- Reduces bounce rate
- Increases SERPs rank
- Easy to understand
- Better outreach opportunities
- Boosts brand awareness
- Shows your expertise
- Strengthens your SEO
How Do I Create an Infographic for SEO?
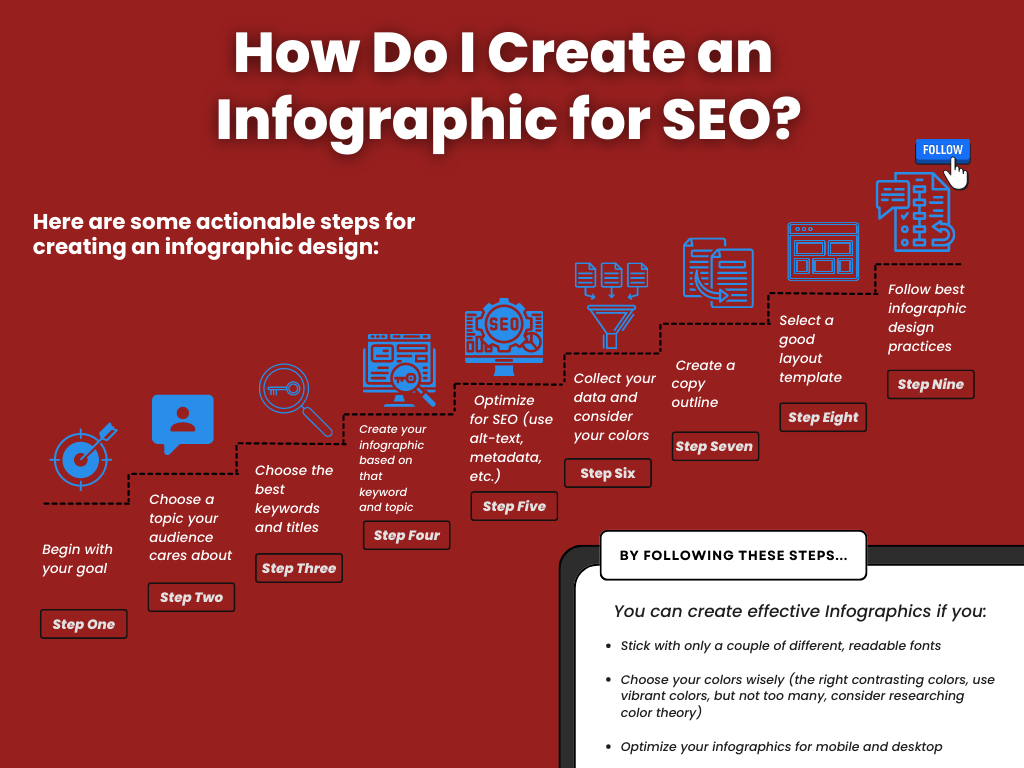
Here are some actionable steps for creating an infographic design:
Step 1: Begin with your goal
Step 2: Choose a topic your audience cares about
Step 3: Choose the best keywords and titles
Step 4: Create your infographic based on that keyword and topic
Step 5: Optimize for SEO (use alt-text, metadata, etc.)
Step 6: Collect your data and consider your colors
Step 7: Create a copy outline
Step 8: Select a good layout template
Step 9: Follow best infographic design practices
By following these steps, you can create effective infographics:
- Stick with only a couple of different, readable fonts
- Choose your colors wisely (the right contrasting colors, use vibrant colors, but not too many, consider researching color theory)
- Optimize your infographics for mobile and desktop
Choose a topic that best meets the needs of your target audience.
For example, Hubspot is a leading expert in the field of SEO, they post statistics using charts, graphics, and other visuals to increase their backlinks, traffic, and much more.
Keyword research is such an important aspect of SEO, it is also useful when creating infographics.
Target keywords in the same way you would use them in your other pieces of content, such as blog posts.
For additional help, try out HOTH Google Keyword Planner.
It would be best to optimize your infographic in a similar way you would optimize a blog post and any other images you use. This will help Google’s crawlers understand your image.
For example, here are some tips for infographic optimization:
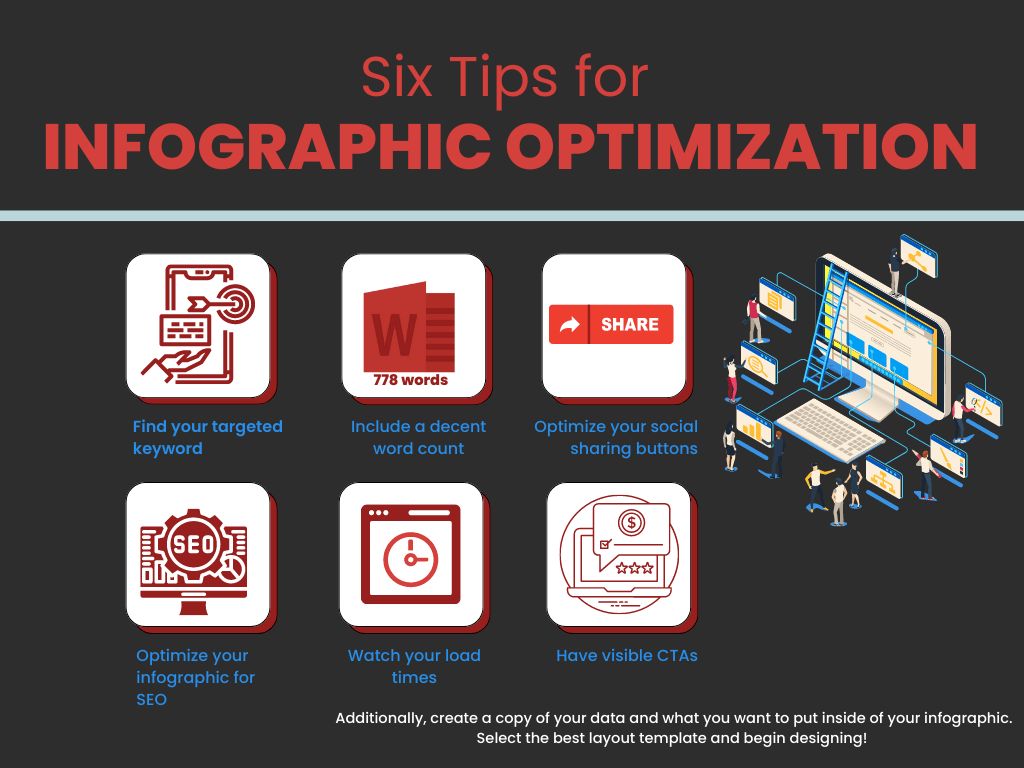
- Find your targeted keyword
- Optimize your infographic for SEO
- Include a decent word count
- Watch your load times
- Optimize your social sharing buttons
- Have visible CTAs
Additionally, create a copy of your data and what you want to put inside of your infographic. Select the best layout template and begin designing!
What should I include in an infographic for SEO?
You should include your collection of data, sources, and relevant information you gathered in your copy.
Infographics are images, therefore Google’s crawlers can’t read them like regular text-based content.
There are several ways to get around this to make sure your web pages where your infographic is displayed is optimized for search engines as well as your target audience.
Here are a few things you should include in your infographic:
Optimize your filename and use commonly supported file types
When it comes to optimizing images for Google, experts recommend using descriptive file names for the pictures you decide to use.
Infographics can be optimized for SEO in the same way.
A filename is exactly what you would expect, it’s the name of the image file that you save onto your computer before you upload it.
A good practice would be to reduce the file size of your image, use commonly supported file types, and supply an image sitemap file.
Naming your images for SEO can improve your search engine rankings and organic traffic, this tip is easy and only takes a couple of seconds to complete.
With that said, here are some tips for optimizing your filename:
- Use clear and descriptive file names
- Use keyword-rich alt text
- Reduce the file size of your images
A couple of ways to reduce your file size are:
- Crop your images to the correct size of your page width
- Show a smaller image
- Reduce the color depth
Additionally, it is recommended to use JPEG as the first choice for a file extension, and PNG as a second choice. It’s also a common practice to have the extension of your filename match the file type.
Add your alt-text and metadata
The reason that alt tags and meta tags are important for images is that it helps Google index and crawl your website.
In addition to crawlers, it also helps your content grab your audience’s attention and convey whatever message you are trying to send.
Here are a few tips for adding alt-text and metadata:
- Describe the image
- Add context that relates to your topic
- Keep your alt text less than 125 characters
- Don’t start an alt text with “picture of”
- Use your keywords
Additionally, keep an eye on page speed and load times.
In fact, Google’s research showed that the chance of a bounce increased by 32% when a page load time went from one to three seconds.
Optimize your header tags
Header tags are useful for your audience and search engines not only because it offers a preview of the content that they’re about to read, but because Google’s algorithm can help provide context on what your page is all about.
This also helps provide hierarchy.
Header tags help describe what your content will be about. It is also a good practice to use your target keywords in your H1 header, H2, and H3.
Here is some advice on crafting your header tags:
- Use only one H1 tag per webpage
- Your titles should have a logical sequence
- Include your main keyword in your titles
- Clearly state the subject of your section
Furthermore, optimizing your HTML and URL is important because keywords in the URL are a ranking factor for Google. Short and descriptive URLs can help with link-building and user engagement.
Best practices for HTML and URL optimization are:
- Analyze your site data
- conduct thorough keyword research
- Optimize for on and off-page SEO
- Test your website for mobile-friendliness
Write out your meta description
A meta description should include a summary of what your webpage is all about for someone who may click on your link.
It should clearly tell them what they may gain by viewing it.
Meta descriptions should include a target keyword to help search engines rank and index your content.
A study finds Google ignores meta descriptions over 70% of the time for pages on the first page of search results.
With that said, here are some tips for creating your meta descriptions:
- Consider your audience
- Make it unique and helpful
- Keep it at an optimal length (155-160 characters)
- Use a CTA
- Use your targeted keywords
- Try to avoid using meta description generators
Best tools for SEO infographic creation
Here are some tools to help get you started:
Visme
Visme is an infographic creation tool. It helps you create different visuals for your websites such as infographics, web banners, professional resumes, and even interactive presentations.
They offer a pretty large selection of icons and graphics. Visme is simple and flexible for beginner use.
It’s a great tool for anyone who doesn’t have much experience with graphic design.
You can choose a template or begin to create it on a blank canvas. It’s free with a premium version.
Venngage
Venngage infographics creator tool offers a ton of template charts, maps, and icons. This data visualization tool offers website owners three steps to help them create an infographic design.
With this tool you can:
- Drag and drop library pictures
- Create custom icons
- Font customization
The tool allows you to save your infographics as images, PDF format, or for easy sharing on social media platforms, websites, and blogs.
Canva
Canva is an amazing graphic design tool that allows you to design infographics, presentations, resumes, business cards, logos, and so much more.
You can even animate videos and some irons. Canva offers versatility in design creation whether you’re trying to make personal or business designs.
This awesome tool has everything you need to create some of the best-looking visual content.
Infographics and Your SEO strategy
Infographics and other visual elements can enhance your SEO efforts.
Infographics run a higher chance of becoming viral and viral content is shared frequently across a huge range of platforms.
With that said, infographics can reach huge audiences whereas a blog post may not.
In fact, studies have shown that content that contains infographics or images can actually generate 94% more views compared to content without.
Here are some helpful tips for adding infographics to your content strategy:
- Create your infographic strategy plan
- Set your goals
- Choose your social media channels for posting
- Design your infographic and create your posts with relevant keywords and hashtags
- Analyze results and adjust accordingly
If you include links inside of your infographics, you can bring even more visitors back to your website with link building.
Here are a few ways you can promote your infographic:
- Create a social media plan to post your infographics
- Pitch to popular blogs and influencers discussing your data design
- Optimize your infographics for SEO (this part is vital)
- Repurpose your infographics into other forms of content
- Promote your infographics both on and offline (word of mouth, printables, etc)
Let’s Wrap it Up
Infographics are a fantastic way to boost traffic, brand awareness, and user experience.
You can use infographics to grab your audience’s attention and keep it on your website for much longer than regular text-based content.
You also have the option to add infographics if you’re on our HOTH X managed SEO plan.
If you aren’t sure where to start, consider booking a call with one of our experts today!
Also, you can sign up for free and take full advantage of our free SEO tools.

Thanks for this good piece of content. Never tried Infographics for link building. Will definitely give it a try.
Cheers
Denis
Infographic is improving traffic. Thank you for sharing your great ideas
very informative and nice blog
Jess, thanks for the useful article!
Infographics are an effective and efficient way to promote content online. Instead of having to write a post from scratch, you can simply create an infographic and reuse it in different places. They can be easily incorporated into existing posts, saving time and money. In addition, infographics can be added to one of your cornerstone articles, allowing you to ask for a link back in return when pitching the infographic to other bloggers.