Quick Links
Infographics are not a new concept, but many content marketers and SEOs are understanding how valuable infographics can be for not only educating their audience, but improving your backlink profile naturally.
The main benefit is that such infographics can help to simplify complex information and make it more engaging for audiences, resulting in increased comprehension and retention of key messages.
It also just makes your pages prettier and more shareable. 💁♀️
But today, we’re gonna dive into a huge trend revolving around infographics:
Infographic link building 🔗
That’s right, creating your own infographics for the purpose of obtaining high quality backlinks from unique domains.
As an SEO, if you’ve ever done manual or link building campaigns through blogger outreach, you SHOULD KNOW how important it is to make your pitch unique because it can make all the difference in securing high-quality backlinks for your website.
Building links organically is hard.
That’s where infographic link-building changes the game completely.
Trust me, we know how to generate links and improve organic traffic:

Why Use Infographics For Your Link Building Campaign
When you reach out to other websites to request a backlink, you’re essentially asking them to vouch for the quality of your content.
If your pitch is generic and lacks personalization to the website owner, it’s unlikely to stand out from the many other pitches that webmasters receive on a daily basis.
In fact, it might even be seen as spammy or low-quality, which can hurt your chances of getting a backlink.
On the other hand, a unique outreach pitch can help you establish a connection with the webmaster and demonstrate the value that your content can bring to their website.
And many people don’t have the in-house skills to create a stunning and informative infographic to enhance their content. That’s why creating infographics is such a unique opportunity for link-building.
By customizing your pitch and the infographic you can create content more unique to their website and audience, you can show that you’ve done your thorough research and that you genuinely believe that an exchange would be beneficial for both parties.
Additionally, a unique infographic outreach pitch can help you establish a positive and professional relationship with the webmaster, which can lead to future collaboration opportunities.
And maybe even some new friends along the way.
So, take the time to craft a stunning infographic and include a personalized outreach pitch that showcases the value of your content and builds a connection with the webmaster that you want a link from.
But how?
Today I’m gonna show you the exact techniques that us SEO professionals use to create a winning strategy for link-building with infographics.
Let’s jump into it…
Elements of a Infographic Link Building Campaign
You and I both get dozens if not hundreds of spammy outreach emails of either people asking for a backlink or trying to sell links from other sites, that anyone can post on.

So if you’re doing link-building outreach, you need to stand out in order to actually get people to open your email let alone respond to it.
That’s were a strategic and calculated infographic link building strategy can help.
A few of the techniques in this strategy include:
- Determine your topic and research other infographics used for link building
- Design a unique and captivating graphic
- Post with a useful piece of blog content
- Share the infographic on socials
- Share on infographic directories
- Reach out to relevant websites/bloggers and build a relationship
But before we cover how to use these infographics to build links, let’s talk first about the different types of infographics and their unique benefits.
Types of infographics that you can use
If you’re going to create a link-building infographic, there are many types of different styles of infographics that you can use.
Below, I’ll list some of the most common types and a provide a brief explanation and examples of each.
There are a variety of different infographic styles to create for your infographic for link building or link building outreach.
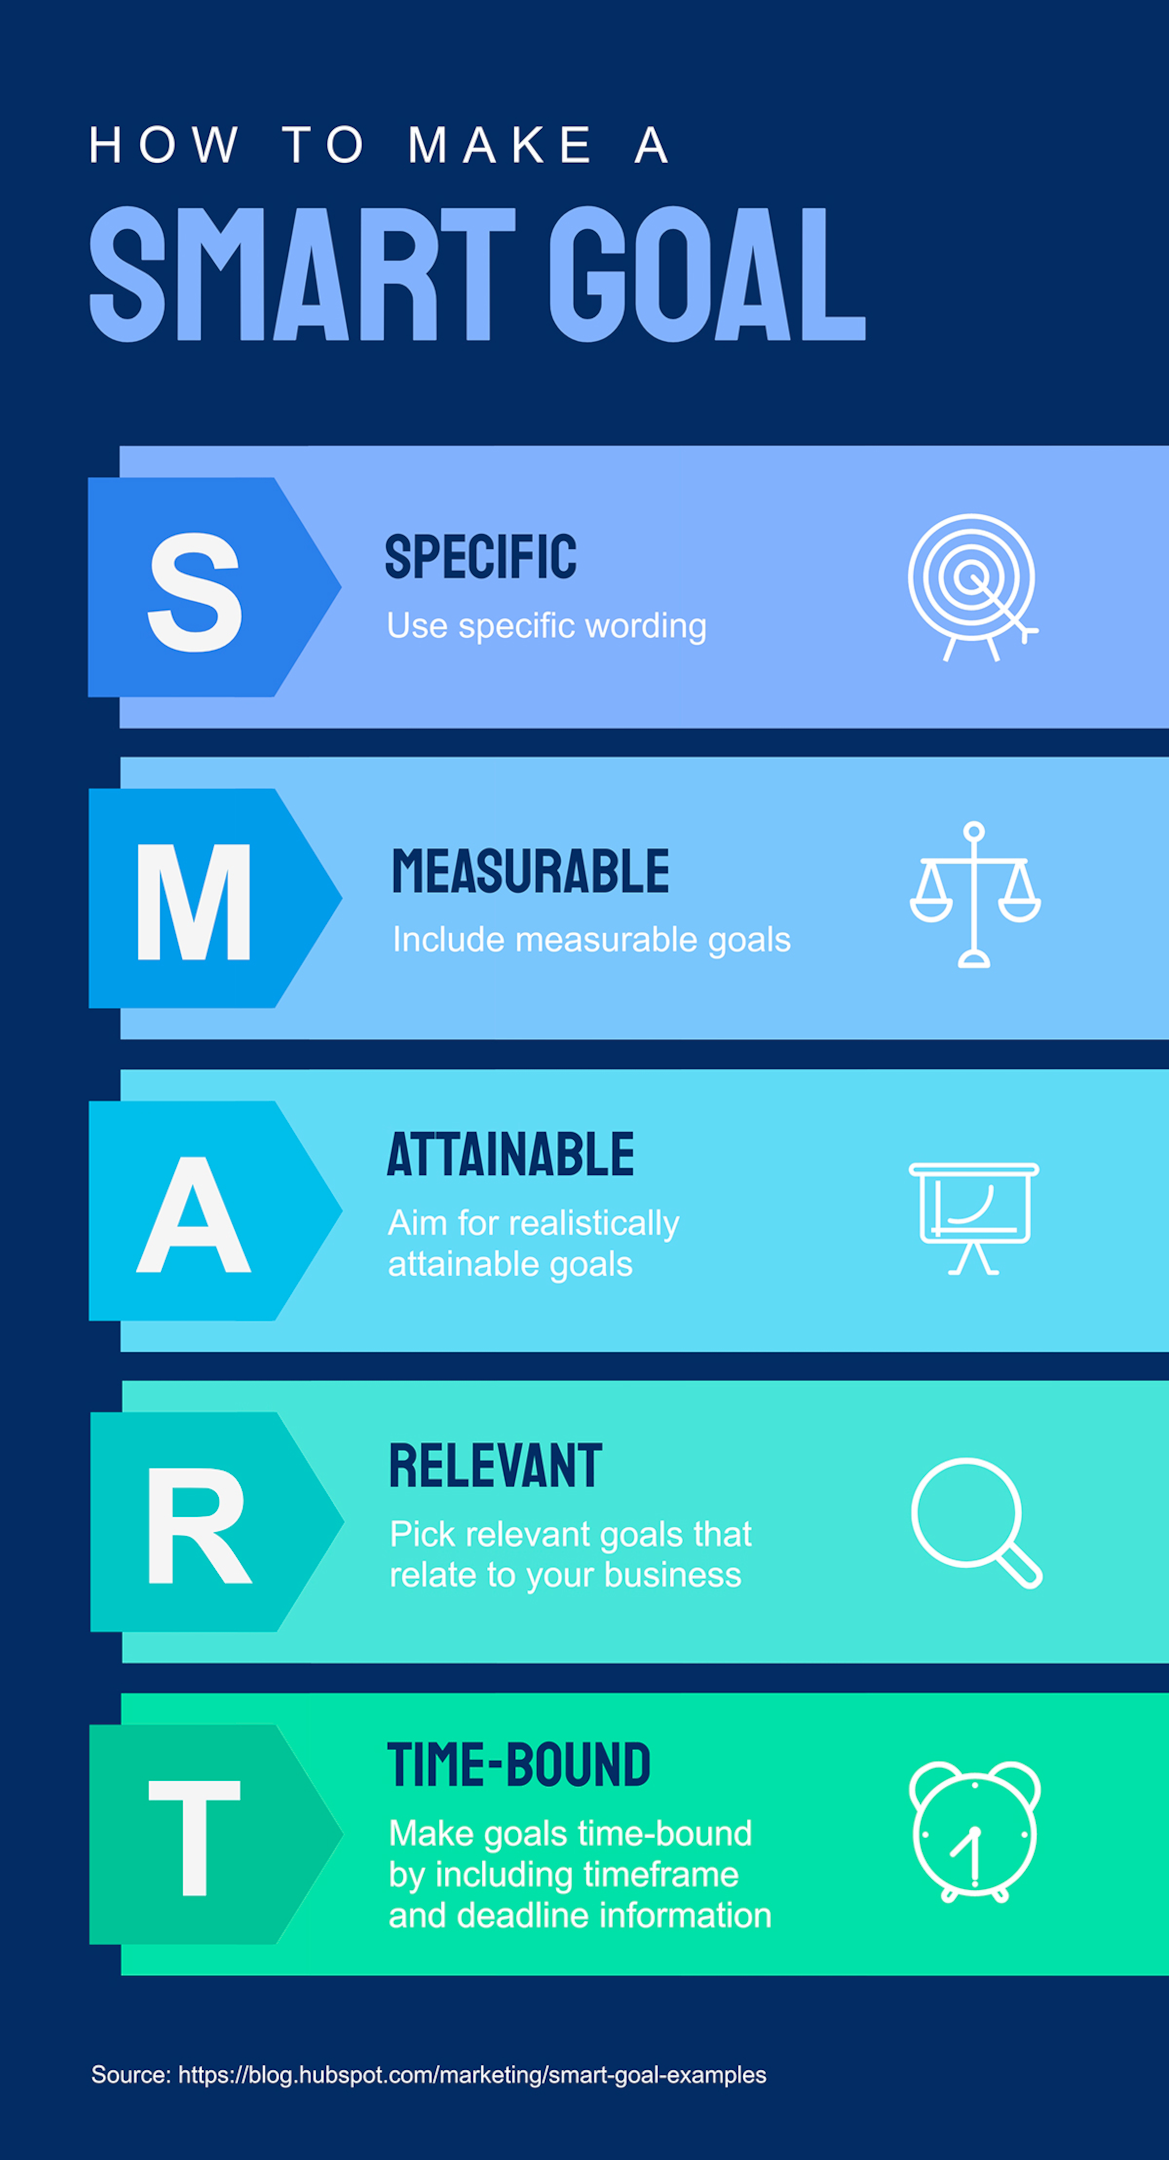
Informational Infographics
An informational infographic is a visual representation of data or information designed to educate or inform the viewer on a specific topic.
It typically includes graphics, charts, and other visual elements to help simplify complex information and make it more easily understandable.
The main goal of an informational infographic is to communicate information in a clear, concise, and visually appealing way, making it an effective tool for content marketing, educational materials, or any situation where information needs to be communicated quickly and effectively.
Source: https://visme.co/blog/types-of-infographics/
Process Infographics
A process infographic image is a visual representation of a series of steps or processes that are involved in completing a task or achieving a specific goal.
Process infographics can be used to communicate complex processes in a simple and easy-to-understand format, providing a clear visual map and guide for the viewer to follow.
They often use arrows, icons, and other graphic elements to visually represent each step, making it easy for the viewer to grasp the flow and sequence of the whole process.
Process infographics can be used for a variety of purposes, such as instructional materials, user guides, and workflow diagrams, and can be an effective way to communicate complex information quickly and clearly.
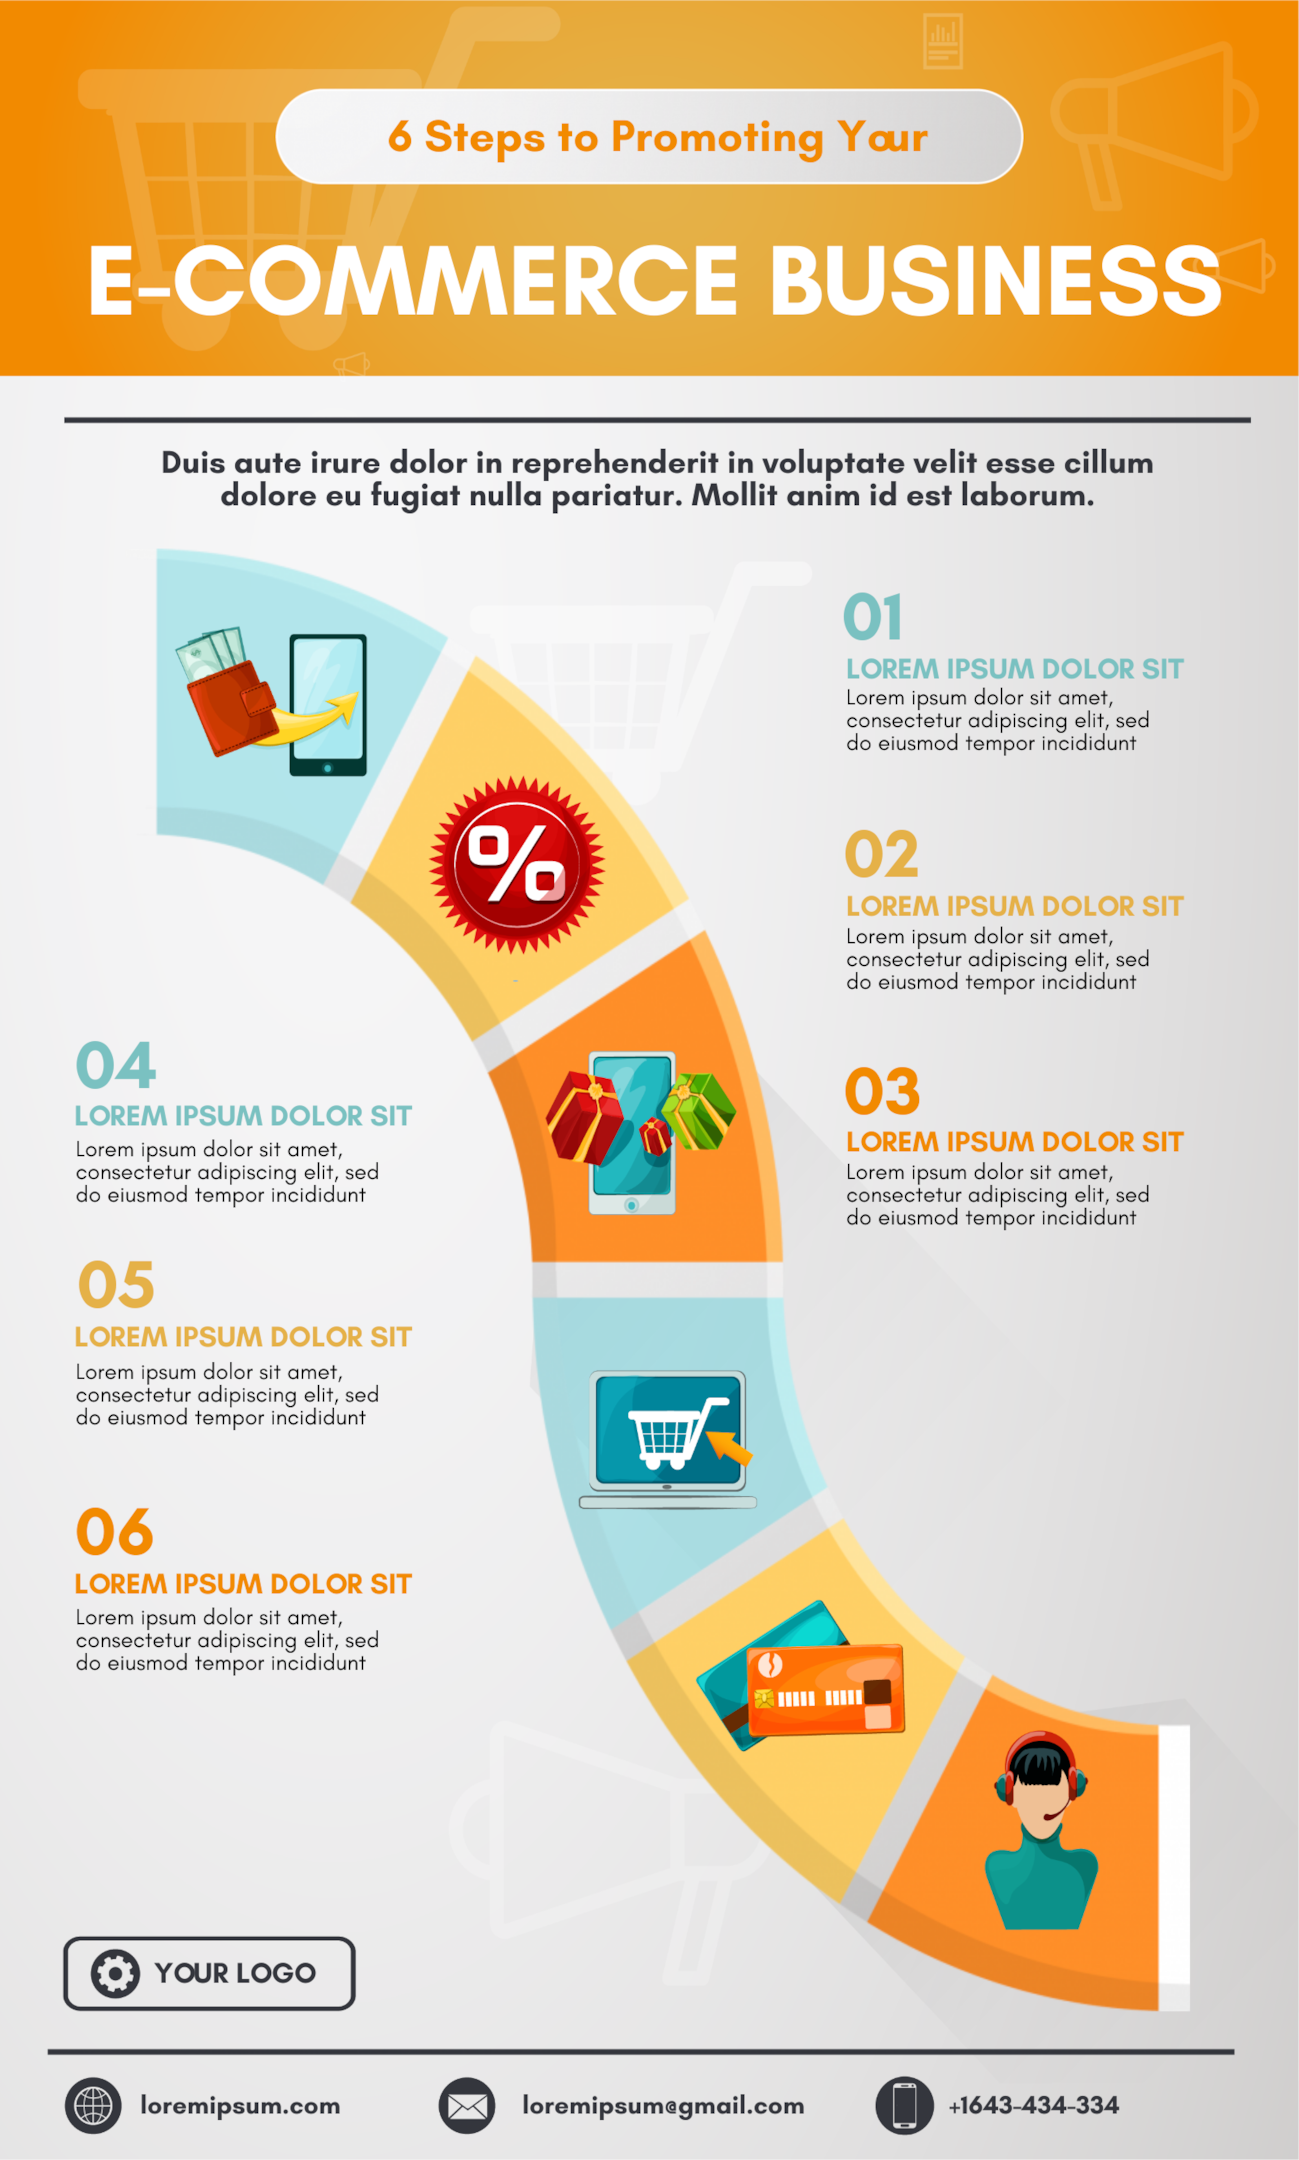
List infographics
A list infographic is a visual representation of information presented in a list format. It typically includes a series of items or points, each accompanied by a corresponding graphic or icon. List infographics can be used to present a variety of information, including statistics, tips, or features of a product or service.
They create infographics that are often designed to be visually appealing and easy to scan, with bold headlines, clear graphics, and concise descriptions. List infographics can be an effective tool for content marketing, as they can be easily shared on various social media platforms and are often more engaging and shareable than traditional text-based content.
They can also help to break up long blocks of text and make information more digestible for the reader.
Statistical Infographics
Statistical infographics are visual representations of data and statistics that are designed to communicate complex information in a clear and visually appealing way.
They often use charts, graphs, and other visual elements to help simplify and condense large amounts of data into an easily understandable format. Statistical infographics can be used to convey a wide range of information, including trends, patterns, and correlations in data, as well as comparisons between different sets of data.
They are often used in fields such as marketing, finance, and social sciences to help analyze and interpret data and make informed decisions based on all the data and results. Statistical comparison infographics can be an effective tool for content marketing, as they can help to attract and engage audiences, establish thought leadership, and build brand recognition.Comparison Infographics
Hierarchical Infographics
Hierarchical infographics are visual representations of information that are structured in a hierarchical or tree-like format, with the most important or overarching concepts at the top and more detailed or specific information branching out from there.
They are often used to present complex or interconnected ideas in a clear and organized way, making it easier for the viewer to understand the relationships between different elements of the information.
Hierarchical infographics can be used to illustrate a wide range of concepts, such as organizational structures, decision-making processes, or the relationships between different components critical elements of a system.
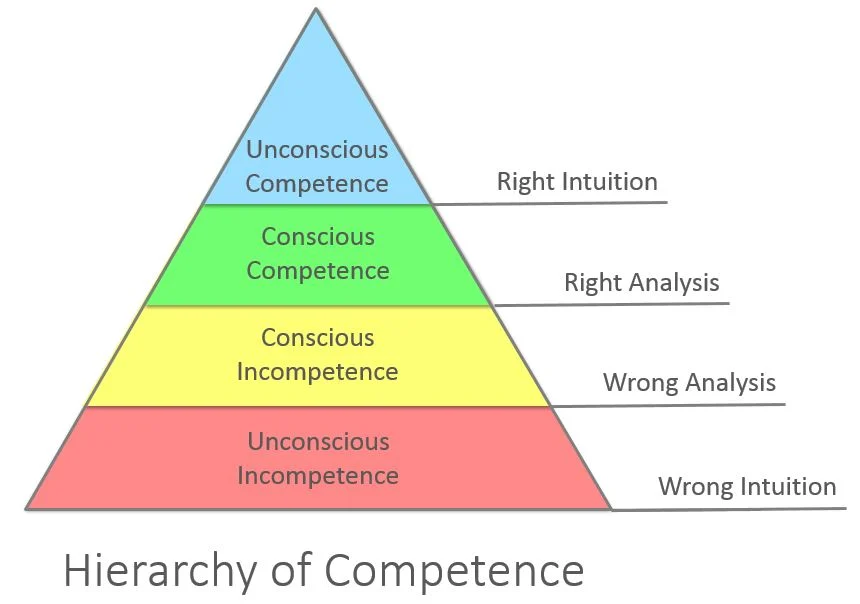
They are often designed to be visually appealing and easy to navigate, with clear headings, icons, and other graphic design elements used to help guide the viewer through the information.
Hierarchical infographics can be an effective tool for content marketing, as they are visual content can help to communicate complex ideas in a way that is accessible and engaging for audiences.
How to Create a Compelling Infographic
To create a compelling infographic, you need to make sure that you are presenting data in a unique way that hasn’t been done before.
If it’s too basic or not visually appealing, who the hell would want to link to that?
Here is a great example of a compelling infographic that can be used for a link building strategy in-building:

And here is a bad example of what NOT to do.
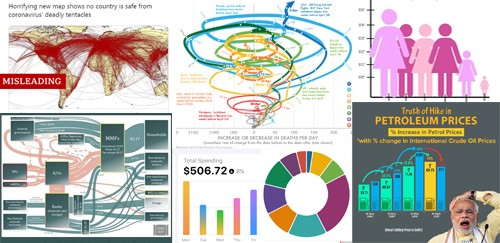
For even more examples and ideas, check out this post.
How to Build Links With Infographics
In order to build links with infographics, you need to create completely unique infographic that will motivate people to link to it NATURALLY.
For example, if you create a comparison infographic about how fresh, canned dog food is better you should be citing data points from studies that prove your point.
And if that data has never been presented in a visual format like an infographic, you found a great opportunity to generate some juicy backlinks with a HELPFUL piece of content.
Step 1. Determine your objective
What’s the purpose of this infographic?
Are you trying to create a compelling infographic that displays high-level industry data like a map with countries’ GDP trends?

Source: https://advisor.visualcapitalist.com/mapped-gdp-growth-forecasts-by-country-in-2023/
Or are you trying to summarize tips on how to organize your bedroom?
Either way, you need to make sure your infographic content is unique. You can use other infographics as a reference to what guys and not recycling info covered by other popular infographics.
Or at LEAST make it visually unique.
The point is that it needs to AID COMPREHENSION.
People hate reading, it takes work and brain power. The brain likes pretty pictures over reading a long and boring blog post.
Otherwise, it will never get traction and no one will want to link to it.
To get ideas on what type of infographic you should create, I recommend using Pinterest to find infographics that are already popular in your niche:

If I do a search for “marketing infographics” for example, Pinterest will show me results that are heavily engaged with, meaning people are sharing and naturally linking to it.
Now you just need to find an idea that works for your piece of content.
For more idea
Step 2. Know your audience and choose a topic for them
Choosing a topic for your infographic is the first step in creating a compelling visual representation of your data.
To start, if you want links from a certain type of website, think about what those authors would want in an infographic, consider their audience and the purpose of the infographic.
What kind of information will they find most interesting or useful?
Look for data that tells a story or highlights a trend, and make sure that it is relevant to your audience.
One way to find successful infographics besides Pinterest and other sharing sites is by using Ahrefs, an SEO tool.
You can search for infographics related to your topic and start brainstorming ideas.
For example, if you’re doing SEO for a dentist, you might search for things such as ‘dental infographic’.
Next, you want filter results by ‘referring domains’ to find infographics that have attracted a good amount of links
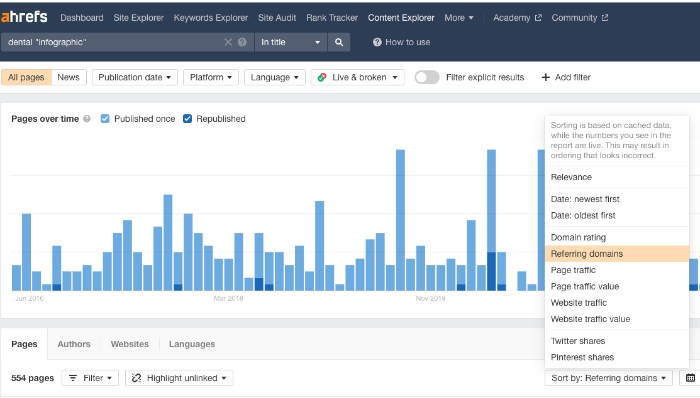
Choose four to five highly successful infographics based on the number of links they have attracted.
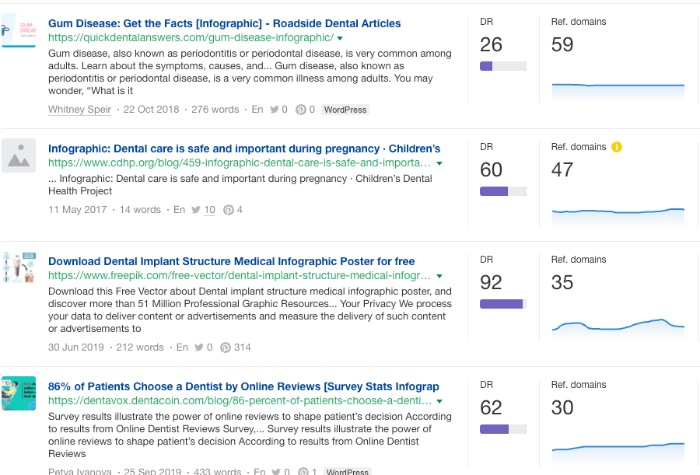
Finally, you must decide on your concept and title.
Brainstorm a list of possible topics and then narrow it down based on keyword research and how well it fits with your goals and how feasible it is to create an infographic around that topic.
To improve the effectiveness of link building infographics, we usually merge two or three concepts into a single high-impact infographic.
Consider what types of data would be the most visually interesting and how you can communicate that information in a clear and concise manner.
- Do they need statistical data summarized?
- Do they need a comparison between two methods of writing?
- Do they need a geographic map charts an infographic for data visualization?
Step 3: Conduct Research and Gather Data
Once you have a topic, it’s time to start researching and gathering data. Look for reliable sources of information and make sure that you are collecting data that is accurate and relevant to your topic.
Organize your data in a way that makes sense and is easy to understand.
Consider the visual elements that you might want to use to communicate your data, such as graphs, charts, or maps.
This will help you to determine what kind of data you need to collect in order to create an effective infographic
Step 3. Design the infographic for your audience
Make sure to pick style from the list above that will appeal to your target audience (or the target audience of your link prospect) and make sure that the type of infographic you choose to use makes sense for the data you are using.
For example, you wouldn’t use a comparison infographic if you are trying to show a map of the US.
Step 4. Run an effective outreach campaign
Alright, now that you got yourself a nice fancy new infographic, it’s time to start letting people know and sharing it where you can to get it in front of eyeballs, and get people to link to it or embed it on their website.
Send to infographic directories
You’ll want to make sure that your infographic is shared on infographic directories and image sharing sites like Pinterest and Flickr. Here is a list of the most popular ones:
- Visual.ly
- Visualistan
- Slideshare
- Infographics Archives
- Infographic Journal
- Infographic Bee
- Graphs.net
- Flickr
- eLearning Infographics
- Cool Infographics
- Daily Infographic
- Behance
Share your infographic on social media
Once you’ve created a great infographic, get it out there! Share it through social media channels like Facebook, Twitter and LinkedIn. Reaching out to bloggers and influencers who have written about the same topic can also be effective.
Finally, don’t forget to link back to your website when sharing the infographic – this will help drive traffic back to your site which is great for SEO purposes too!
Publish the Infographic to Your Website
Releasing your infographic on your website is a great way to drive traffic and get quality content noticed. Make sure it’s optimized for SEO by including keywords in the post title, URL and content. Don’t keyword stuff, make it relevant and natural.
This will help make it easier for search engines to index your page, increasing the chances of appearing in relevant Google searches.
Reach out to relevant websites
Just creating the infographic and posting it won’t be enough to generate juicy backlinks
You gotta ask for ’em. Look for relevant influencers and bloggers who would find it useful to use your infographic.
Reaching out to other relevant websites can be a great way to get links back to your website. Look for websites that are related to the topic of your infographic and contact them about including it on their website. Offer a short description of the infographic, why it would be beneficial for their audience, and provide them with an embed code or link back to your site.
Follow-up With Prospects
Finally, don’t forget to follow up with prospects that you’ve sent outreach emails or messages too. It’s important to keep them engaged as they may not have responded right away but could be interested with a gentle reminder. A polite follow-up message can often be enough to secure a link back!
How to Run an Effective Link Outreach Campaign Using Infographics for Link Building
Here’s a step-by-step guide on how to use Ahrefs to find possible opportunities for a backlink outreach campaign.
- Use the “Content Explorer” tool to search for topics related to your infographic, such as “marketing recession trends”. This will give you a list of articles and websites that have written about this topic.
- Look for websites that are relevant to your infographic and have a high DR or amount of traffic. These are potential targets for outreach that will help get some nice authoritative links.
- Create a list of potential targets and start reaching out to them with your infographic. Personalize your outreach emails and explain why your infographic is relevant and useful to their audience.
By following these steps, you can use Ahrefs to find potential opportunities for link outreach and increase the number of backlinks pointing to your website through your marketing recession trends infographic campaign.
How do you create an original infographic?
If after reading the steps above, you’re still not quite sure how to produce a better infographic, for link building that will help you generate backlinks and add depth to your own content assets, I highly recommend to check out our Done For You Infographic product, HOTH Infographics.
You can provide a topic, title and any specific instructions and our team will create a visually stunning and informative infographic that will not only help improve your content, but will allow you to generate some nice backlinks from relevant domains.
Here is our process:
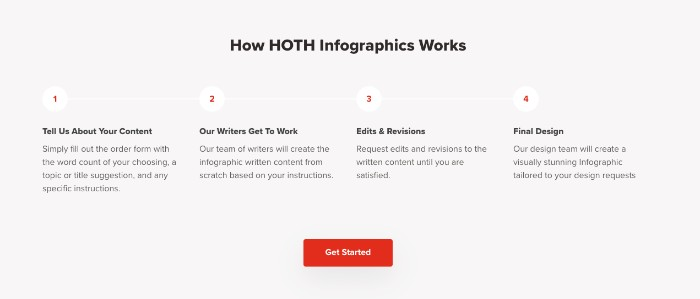
Why Use Infographics For Link Building – A Summary
There are many ways to build links, and one effective method is to create and share infographics online as detailed above.
For some of our clients, we’ve seen this technique can boost your site’s traffic by up to 12%, in addition to enhancing your site rankings and organic traffic.
Original graphics like infographics are the most successful visual content format. Creating an original infographic that’s visually appealing, informative and entertaining can make your content stand out in a crowded marketplace.
In summary, an effective link building strategy should include both organic and non-organic techniques to generate backlinks
Organic techniques are used to gain naturally occurring links from other websites without manual outreach or link buying.
Non-organic techniques use manual outreach (asking) for backlinks from relevant websites or influencers.
Infographics represent a great opportunity for both organic and non-organic link building strategies.
To ensure your infographic stands out you need to create something interesting, unique and engaging that people will want to share on social media platforms like Facebook, Twitter, Instagram and Pinterest.
This will help boost its visibility and increase the chances of gaining some valuable backlinks.
Good luck with your infographic link building efforts!






Very Nice and Informative Blog you have shared with us.